
Positives
- U.S. unemployment rate remains low at 4.3% in August
- U.S. GDP increased 3.8% (Q2 release)
- U.S. tech AI sector continues rallying
Risks and Concerns
- U.S. government shutdown may affect markets
- U.S. inflation at 2.9% CPI trailing year in August
- Tariffs currently causing market uncertainty & volatility
The Quarter in Review
The U.S. Federal Reserve (Fed) cut interest rates in September for the first time this year with a 0.25% rate reduction to a 4.09% effective short-term rate. The Fed has a dual mandate of price stability and full employment, and a weakening unemployment rate of 4.3% (up from 4.1% in July) overruled persistent inflation to influence the Fed’s decision. However, the Fed’s inflation target is 2% and the Consumer Price Index (CPI) measure of inflation is currently at 2.9%. Markets expect two more 0.25% Fed rate cuts before year end, however, just one rate cut may be more likely if inflation does not come down soon. Second quarter’s gross domestic product (GDP) measure of total U.S. economic growth rebounded to 3.8% from -0.6% in the 1st quarter (3rd quarter GDP estimates are released at the end of October). The large differential between 1st and 2nd quarter GDP can be explained by tariffs and their impact on imports (imports are subtracted from GDP because imported goods are not produced by the U.S.). There was a large increase in imports in the 1st quarter in efforts to avoid tariffs and a large decrease in imports in the 2nd quarter after tariffs went into effect.
More big news came at the end of the quarter when the U.S. government shut down due to a dispute over the budget, and it remains shuttered over 2 weeks later (at the time of this writing). Historically, markets haven’t been greatly affected by government shutdowns, as the following chart illustrates. In past shutdowns, 55% of the time, the S&P 500 rose by an average of 0.3%. The average shutdown has only lasted 8 days; this one may affect markets more significantly if it continues to drag on.
S&P 500 Performance During & After Government Shutdowns
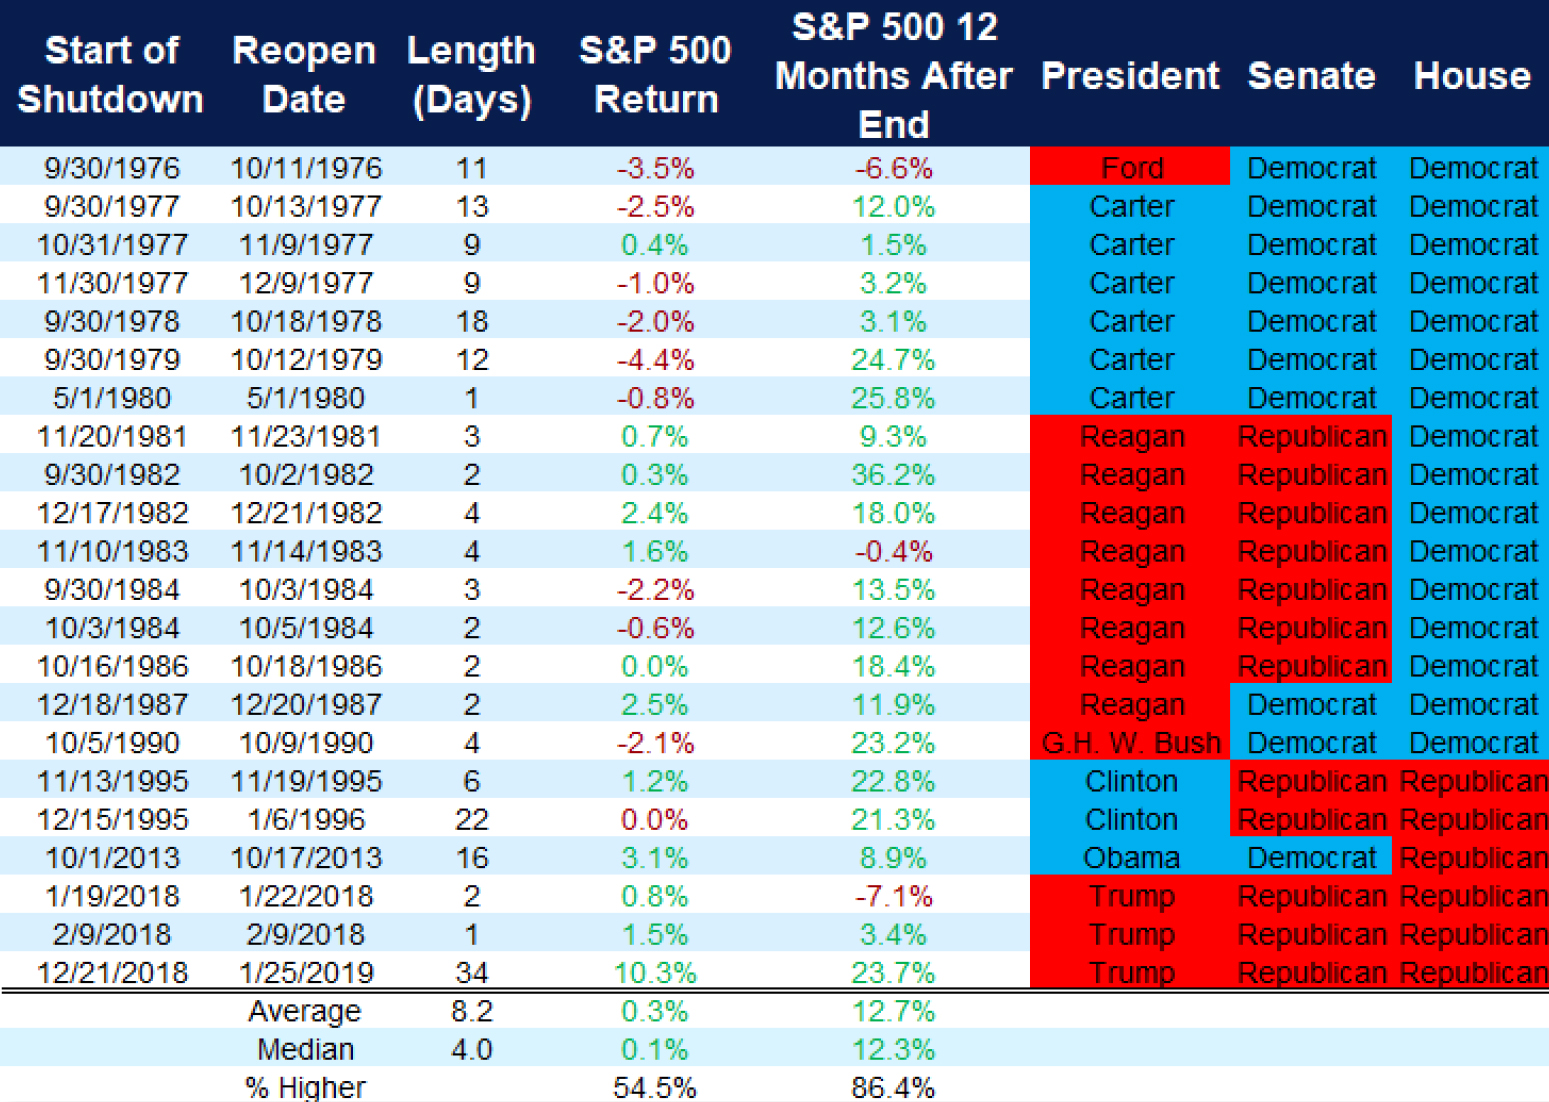
Source: Carson Investment Research, FactSet, 03/07/2025
Current Investment Strategy
Due to elevated market risk and uncertainty, we elected to make no significant investment strategy changes in the third quarter. We maintained a posture of being slightly defensive, with a slight overweight to money market funds as their rates hovered around 4% throughout the quarter – a very attractive yield considering their particularly low risk level. These generous yields will not last, however, given that the Fed has begun a rate-cutting cycle.
The other primary cause of uncertainty and volatility during the 3rd quarter was the U.S. tariff situation, which remains volatile. The following chart shows the announced tariffs vs. those that have been implemented, illustrating that both announced and implemented tariffs are currently expected to rise throughout 2025. However, the U.S. Supreme Court will be adjudicating the legality of the tariffs beginning November 5th, adding more uncertainly to the trade situation. The U.S. actual effective tariff rate rose to 17.9% at the end of the quarter (according to the Yale Budget Lab State of U.S. Tariffs report released on September 26), and is the highest U.S. tariff rate since 1934. However, if the Supreme Court rules that at least some of these tariffs should be removed, we would consider that a bullish sign for the U.S. economy, stock market, and bond market.
U.S. Tariffs: Announced vs. Implemented
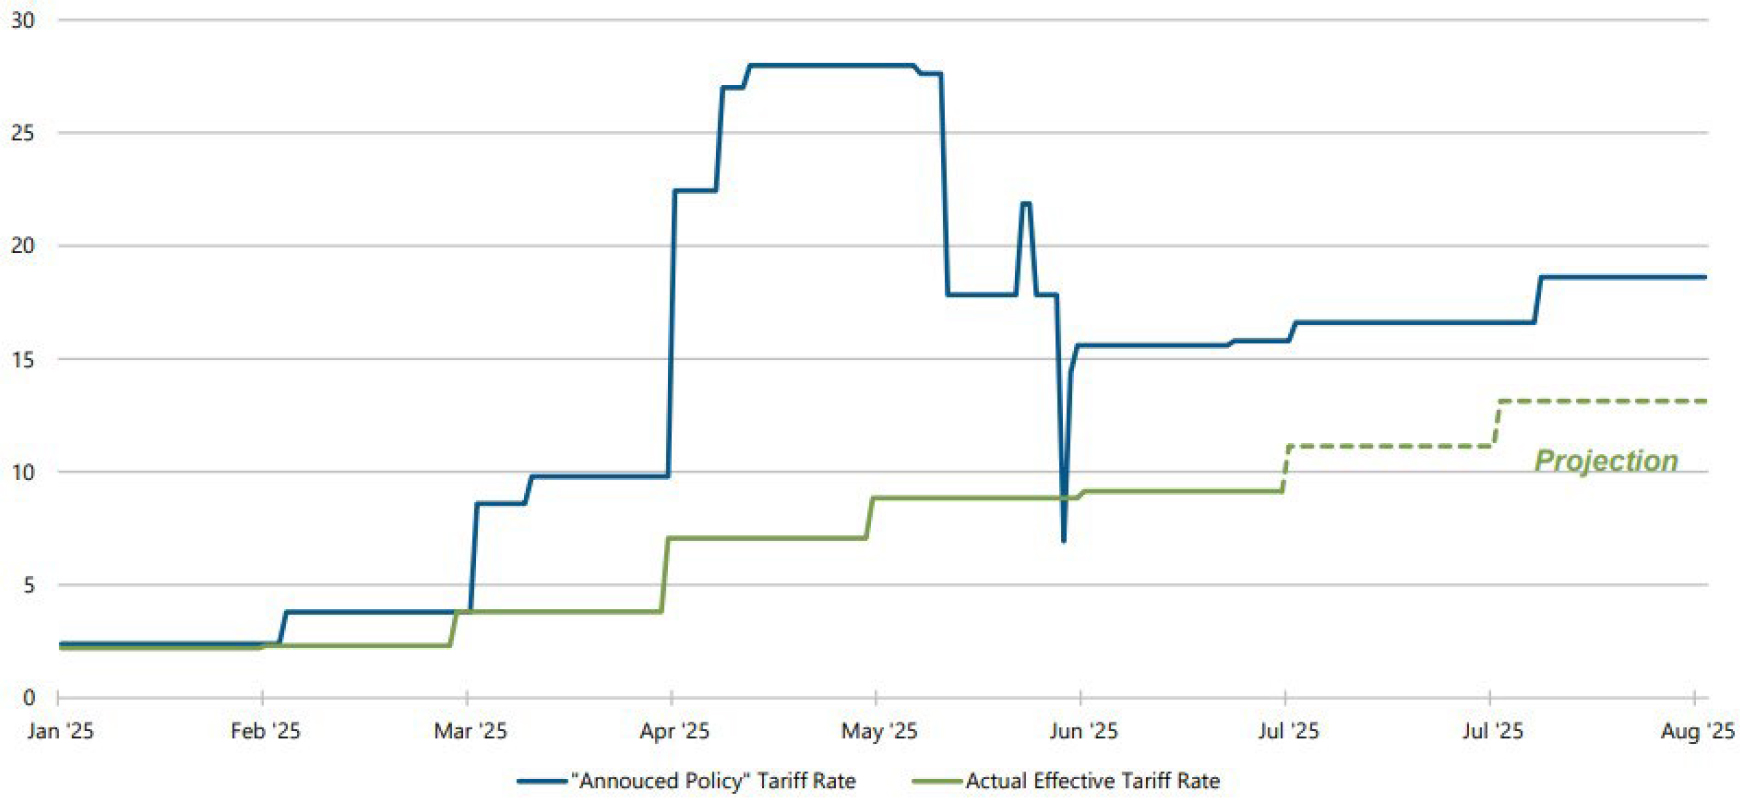
Source: PIMCO, “September 2025 Cyclical Outlook”, data as of August 2025
Future Asset Allocation Changes and Considerations
Our primary investment strategy update for this quarter is to resume extending bond duration. We plan to make incremental moves to reduce money market fund allocations by shifting to ultra short-term bonds. This will result in a small yield increase above cash of approximately 0.40%, but more significantly, we expect short-term interest rates to continue falling as the Fed cuts interest rates.
We also plan to make another move from money market funds this quarter into intermediate-term corporate bonds. Our research leads us to the opinion that U.S. intermediate-term corporate bonds have a far more attractive risk vs. return profile than U.S. treasury bonds in general, with a higher yield and lower interest rate sensitivity (as measured by duration) than both intermediate and long-term U.S. treasury bonds. The following chart shows yield and duration measures for several bond asset classes, revealing U.S. intermediate-term corporate and mortgage-backed securities (MBS) to now be some of the most attractive fixed income asset classes. While most portfolios already have a substantial allocation to mortgage-backed securities, we are considering increasing MBS allocation.
U.S. Bond Sectors: Yield vs. Duration
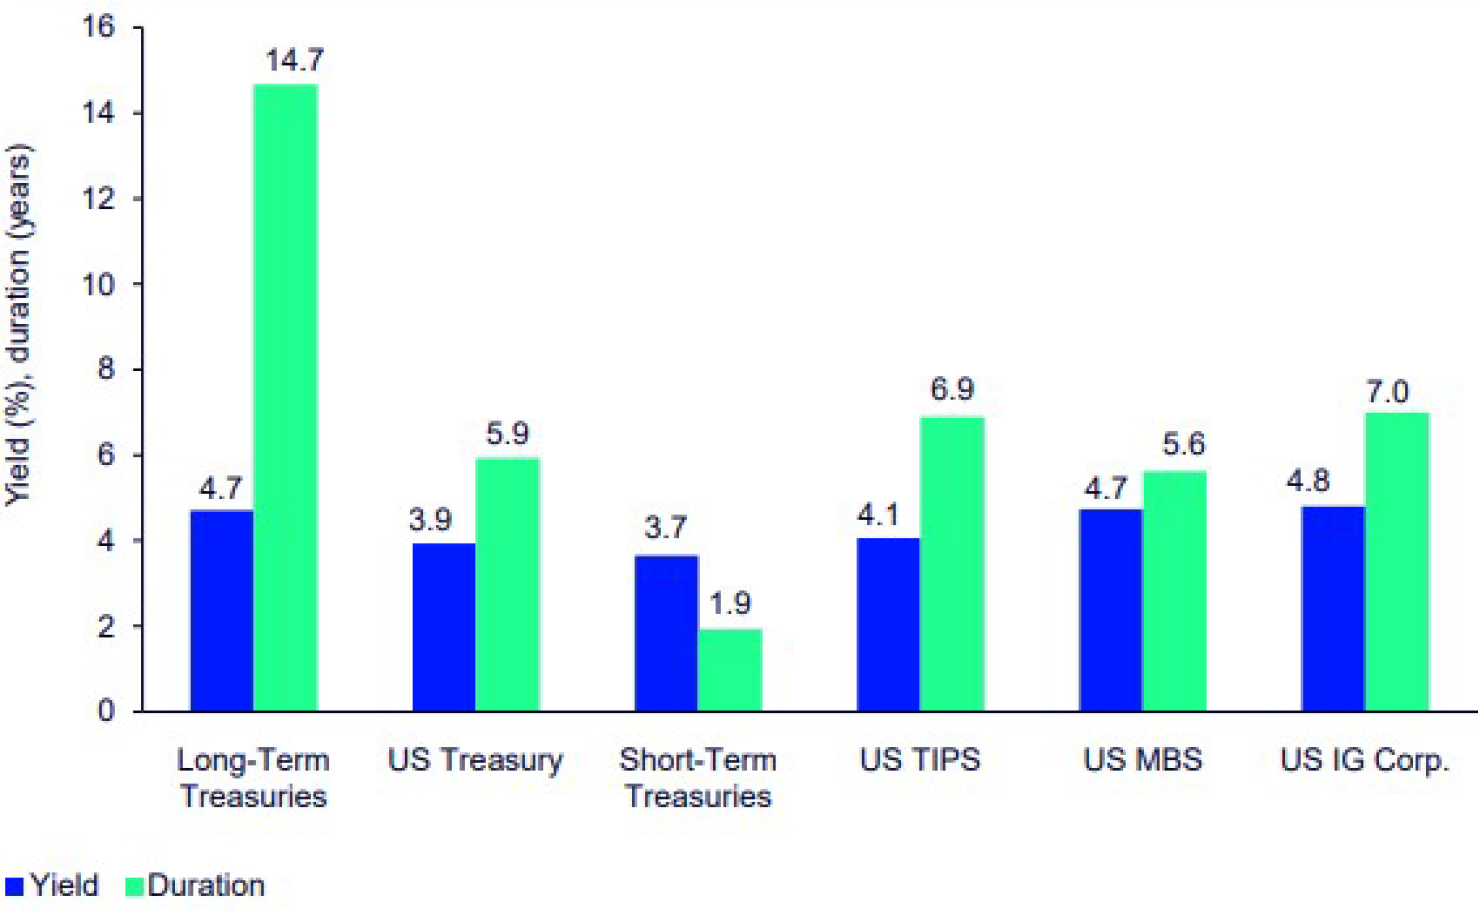
Source: State Street Investment Management, “State Street ETFs Chart Pack”, October 2025 edition
Key Investment Takeaways
- In risk-reduction efforts in the 3rd quarter, we maintained a slight overweight to cash allocations, yielding approximately 4%
- The Fed cut interest rates (for the first time in 2025) by 0.25% in September
- The September Fed rate cut is likely the beginning of a rate-cutting cycle
- Due to Fed rate cuts, we plan to resume extending bond duration this quarter
- Inflation is still above the Fed’s target; thus rate cuts are not likely to occur at every Fed meeting
We will continue to monitor the market risks of this rapidly changing and volatile environment, frequently adjusting as needed with the goal of protecting and growing your investment portfolio. As always, please feel free to contact us with any questions or concerns.
Your Capital Advantage Team